Facebook/META
Recent quarterly reports
Facebook/META releases their quarterly results after market close. The table below shows the immediate share price change following the their last quarterly reports, and as such is a measurement of the markets “surprise” by the information released:
| Earnings date | Price before release (“close” day of) | Price after release (“open” day after) | Change |
|---|---|---|---|
| July 27 2022 | $169.58 | $161.06 | -9.5% |
| April 27 2022 | $174.95 | $202.92 | 16.0% |
| February 2 2022 | $323.00 | $244.65 | -24.3% |
| October 25 2021 | $328.69 | $328.26 | -0.1% |
| July 28 2021 | $373.28 | $361.00 | -3.3% |
| April 28 2021 | $307.10 | $330.12 | 7.5% |
| January 27 2021 | $272.14 | $277.18 | 1.9% |
| October 29 2020 | $280.83 | $274.50 | -2.3% |
| July 30 2020 | $234.50 | $255.82 | 9.1% |
Main drivers of share price
When looking at the reasons behind the sharp changes in share price, it seems that the market was surprised by changes in user growth and monetization:
Feb 2, 2022: Facebook loses users for the first time in its history (Washington Post)
Feb 2, 2022: Meta Faces Historic Stock Rout After Facebook Growth Stalled (Bloomberg
Apr 27, 2022: Facebook holds on to users, stock soars (Washington Post)
Apr 27, 2022:: Meta Shares Soar as Facebook Returns to User Growth (Bloomberg)
Jul 27, 2022: Facebook reports first-ever decline in revenue (Washington Post)
Jul 27, 2022: Meta Falls as Sales Miss Estimates in First-Ever Quarterly Drop (Bloomberg)
Modeled daily metrics
Below you will find the output of a model that measures the key metrics on a daily basis. The model is built using automatic data gathering from the very rich digital footprint that Facebook/META has, in particular from the public user engagement with their platforms and the metrics exposed through their advertising products. My testing suggests that the model has an accuracy well within +-1% on a quarterly basis, and as such should by far carry more information than what the market currently seems to have judging by the surprises following company announcements.
If you want to understand in detail how the below metrics are put together, please read through the methodology section. All the data is available for download raw data if you want to explore it yourself.
The user engagement in Facebook/METAs quarterly reports is on Monthly and Daily active people/users for the Facebook app and for the whole family of apps (Facebook, Instagram, Messenger and Whatsapp). Please see the appendix for a detailed overview of what metrics Facebook/META is reporting on.
Daily Active People for Family of apps
Possibly the most important user metric that Facebook reports on is the total number of daily active people across their entire family of applications (Facebook, Instagram, Messenger and Whatsapp). Below is a graph showing the reported metrics (in dark blue) as well as the modeled measurements (light blue) for the following months (not yet reported on metrics):
Do note that the Q3’22 result for Facebook is a point measurement for the “end of Q3” while above July, August and September are averages for those months. The July, August and September are an aggregation of the daily view below:
In principle, the reported Q3 number is the end of the quarter number but my assumption is that Facebook/META in reality is taking a weekly average or something similar to avoid daily volatility working it’s way into the reported number.
Monthly Active People for Family of apps (Facebook, Instagram, Messenger, Whatsapp)
Facebook/META also reports on monthly active people, e.g. people that have had any activity across all their properties any time over the last 30 days.
Daily Active Users for Facebook only
Facebook/META also reports on metrics only for the Facebook property (e.g. Facebook.com and the Facebook mobile app). These metrics cover only users on this property, not users on Instagram, Messenger and Whatsapp.
Monthly Active Users for Facebook only
Monetization data
I have experimental versions of this and I hope to publish them soon. If you’re interested in seeing what I have so far, please contact me.
Methodology
Facebook/META exposes data through a large set of interfaces, but one major area is through their advertising products which happen to also be the driver of the vast majority of revenue for Facebook. Through the advertising products Facebook/META allows anyone to run advertising campaigns where against payment anyone can reach their users. As part of this, Facebook reports on how many users were reached and what the cost was for the ad campaign. To allow for advertisers to plan and evaluate their campaigns they expose a large set of statistics and data.
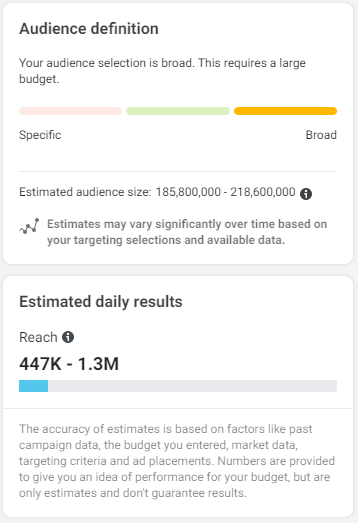
Most notably, they give out data on the reach of campaigns. Below is an example of this reported for a certain geographical, demographic and placement/property targeting:

The parameters can be varied along a large set of parameters, including:
- Location (country, region, etc)
- User age
- Gender
- Interests
- Language spoken
- Platform (Facebook, Instagram, Messenger)
This gives the ability of extracting data about the total reach available at any given time for a subset of these parameters.
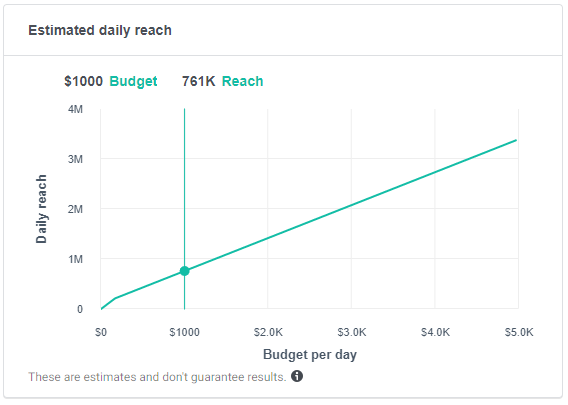
Furthermore, information is given about the cost of reaching this audience:

This gives information about the prices Facebook is charging for engaging and reaching their audience (e.g. monetization data).
Currently, I have automatic jobs that extract ~600 data points by “mystery shopping” four times per day in various places and with various settings. This data is then aggregated in order to accurately derive the reported metrics.
When it comes to the user data, there are two main bias issues:
- Only users that are “monetizeable” are measured. This excludes for example users under the age of 13
- No ads are shown on Whatsapp, and therefore any users only using Whatsapp would not be covered by this data (a problem for the reported “Family” statistics)
Overall though the under-reporting due to the two issues above can be calculated and is 15-20% depending on the platform and geography. Furthermore, in predicting revenue the issues above are actually non-issues as the missed out measured audiences anyway are not generating any revenue for Facebook.
Raw data download
All data shown above can be downloaded here. Please note that this file is updated on a daily basis. It is undocumented but should be fairly self-explanatory.
Experimental data
I’m currently playing around with monetization data and thought I’d show some progress. The graph below shows a few different measurements of normalized monetization data (pay per impression/reach):
As of now it seems that there was a dip in monetization across the platforms during the summer, but that it’s picking up towards the end of August. The graph above is updating on a daily basis.
Appendix
Company reported data
Facebook/META releases financials once per quarter. The table below outlines the key metrics reported on:
| Metric | Description | Breakdowns |
|---|---|---|
| Earnings per share | Total profit divided by number of outstanding shares | No breakdown |
| Total revenue | Total revenue across all of METAs properties | Regional breakdown |
| Advertising revenue | Total revenue from advertising (e.g. excluding Reality Labs) across all of METAs properties | Regional breakdown |
| Costs | Total costs across all of META | G&A, M&S, R&D, CoS, Taxes |
| Capital Expenditures | Total capital expenditures across META | No breakdown |
| Family Daily Active People | (this is a new user metric) Total number of people (as best determined by META) active on a specific day across all META properties (Facebook, Instagram, Messenger, Whatsapp) | No breakdown |
| Family Monthly Active People | (this is a new user metric) Total number of people (as best determined by META) active at least once over the last 30 days across all of META | No breakdown |
| Facebook Daily Active Users | Total number of people active on a daily basis on the Facebook property only | Regional breakdown |
| Facebook Monthly Active Users | Total number of people active on a monthly basis on the Facebook property only | Regional breakdown |
| Facebook Average Revenue per User | Total revenue for the Facebook property divided by the average Monthly Active Users | Regional breakdown |
| Ad impressions | Increase/decrease in number of ad impressions served | No breakdown |
| Price per impression | Increase/decrease in the price paid per impression | No breakdown |
| Headcount | Total number of employees | Indicative breakdown by R&D, S&M, G&A |
| RSU changes | Granted, vested, forfeited RSUs (key component of compensation for R&D) | No breakdown |
| CFO Outlook | Guidance on (1) revenue/cost next quarter, (2) expenses for full year | No breakdown |
Analyst consensus data
Facebook/META is covered by 40-50 sell-side analysts, aggregated (Refinitiv, Bloomberg, FactSet, S&P Capital IQ, Zacks) into consensus on Earnings per Share and Revenue only. StreetAccount provides some expectation on Daily Active Users, Monthly Active Users and Average Revenue per User.
Disclaimer
I’m not a financial advisor. These are merely my personal opinions. If you need financial advice, please consult a licensed professional. Do your own research.